Case 4471 · 87
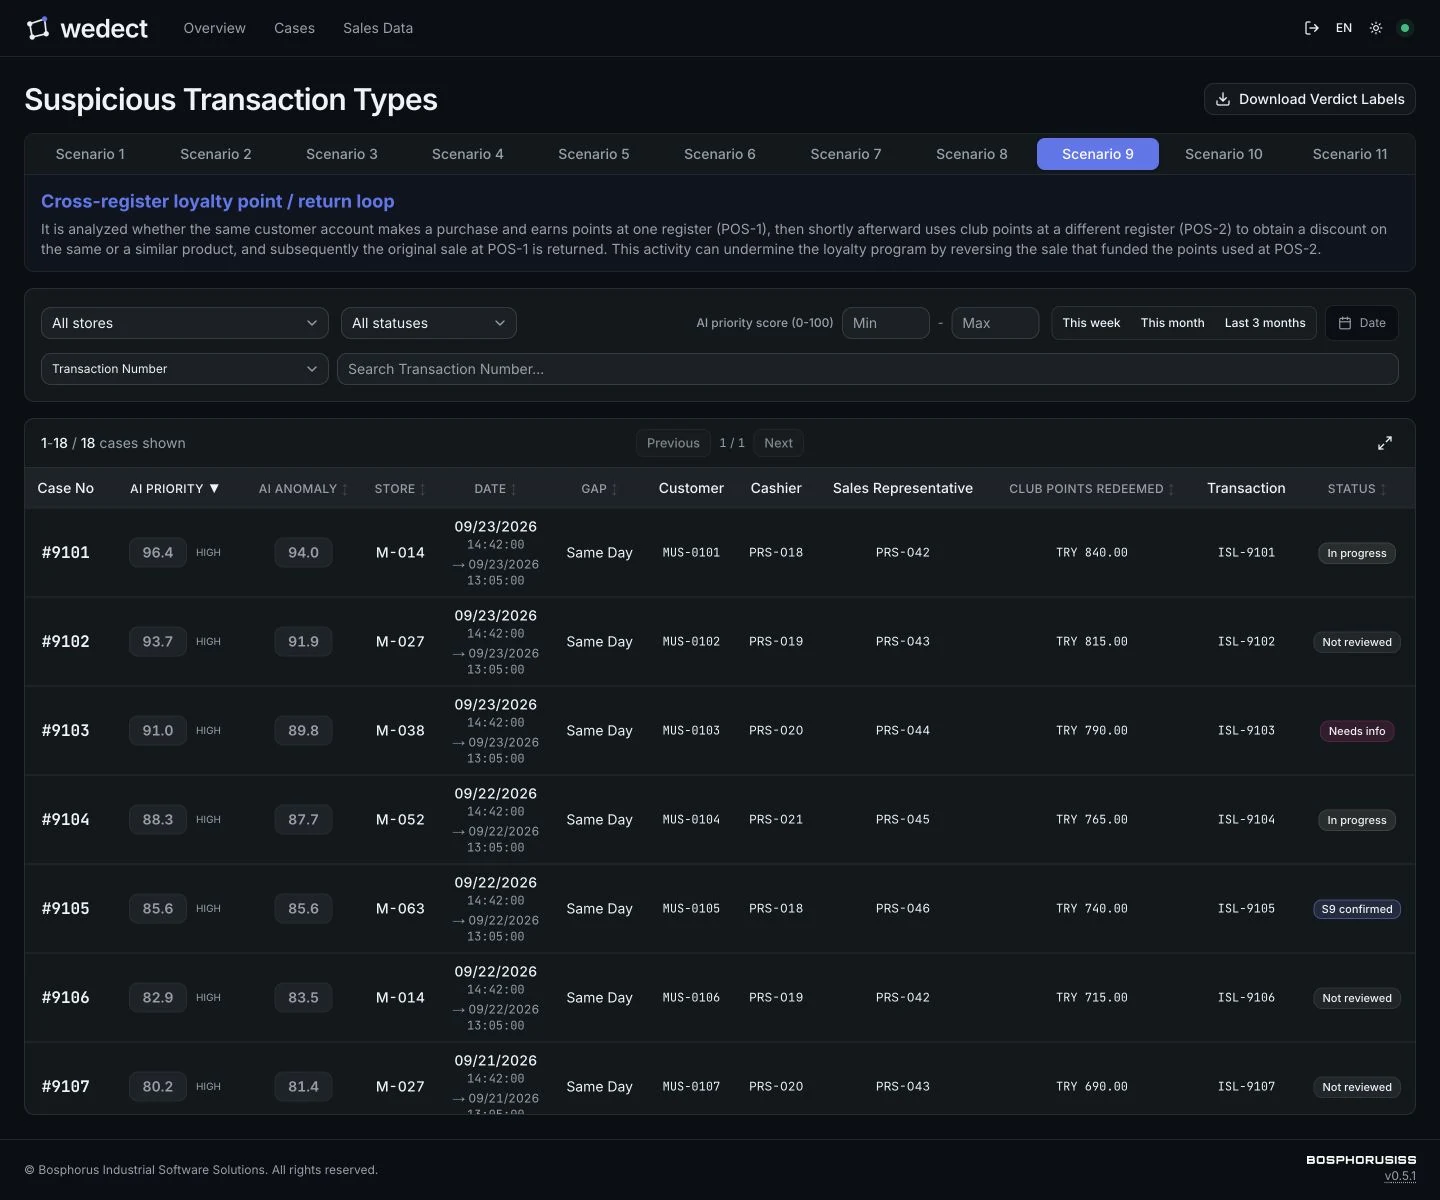
Sale → points → cross-store spend → refund
Part of 8 similar chains on the same terminal, with comparable products, over the last 30 days.
| Where | Store A · Terminal 3 |
|---|---|
| Repeats | 8 linked chains · 30 days |
| Window | Feb 12 – Mar 14 |
Wedect is an analytics layer over your existing transaction data. It finds the loss and fraud patterns that no single transaction reveals.
Transaction Risk Intelligence
In productionAlready running.
Transaction Risk Intelligence
Wedect is an analytics layer over your existing transaction data. It finds the loss and fraud patterns that no single transaction reveals.
The part nobody says out loud
Every case your team has closed started somewhere else — a tip-off, a complaint, a stock count that didn't add up, a pattern too clumsy to miss. The reports confirmed it afterwards. They never surfaced it.
Six hundred thousand rows, filtered eleven different ways. You can sort returns by terminal. You cannot ask whether a return three days later belongs to a sale from another store.
You wrote it after the last incident. It fired four thousand times in the first month. Someone switched it off in the second, and nobody argued.
You audit a sample and hope it resembles the other 98%. You have no way of knowing whether it does.
You find out in October about a pattern that started in March. By then it has repeated forty times.
You do find things. Just never the quiet ones.
Why you can't find it
No rule is broken. No alert fires. The coat is back on the shelf, the points are spent, and the chain is down the value of both. No single transaction is guilty.
The problem isn't that your team isn't looking hard enough. It's that there is nothing to see when you look at transactions one at a time — and that's all your tools do.
A customer buys a coat.
They earn loyalty points on it.
They spend the points — different store.
They return the coat.
So how do you find something that doesn't exist in any single record?
The shift
Customer, store, terminal, product, payment, return, points, coupon — held in one graph, tracked over time. The coat, the points and the refund stop being three unrelated records and become one shape. Once that shape has a name, every other instance of it comes back with it — across every store, and as far back as your data goes.
What lands on your desk
Ranked, each one carrying the reason it's there in plain language. Your team doesn't need more alerts — it has been ignoring alerts for years. It needs a list short enough to actually work through, and a reason it can defend in a meeting.
One live deployment · most recent full year
~$1M in transaction value touched by flagged patterns.
Case 4471 · 87
Sale → points → cross-store spend → refund
Part of 8 similar chains on the same terminal, with comparable products, over the last 30 days.
| Where | Store A · Terminal 3 |
|---|---|
| Repeats | 8 linked chains · 30 days |
| Window | Feb 12 – Mar 14 |
Case 5120 · 79
Manual discount, repeated
Manual discount rate on this terminal has run four times the store average for eleven consecutive weeks.
| Where | Store B · Terminal 1 |
|---|---|
| Deviation | 4× store average |
| Window | 11 consecutive weeks |
Case 5233 · 91
Target-period sale → next-period refund
7 sales in the final three days of the target period, 6 refunded in the first week of the next.
| Where | Store C · 2 terminals |
|---|---|
| Repeats | 7 sales · 6 refunded |
| Window | Target period close |
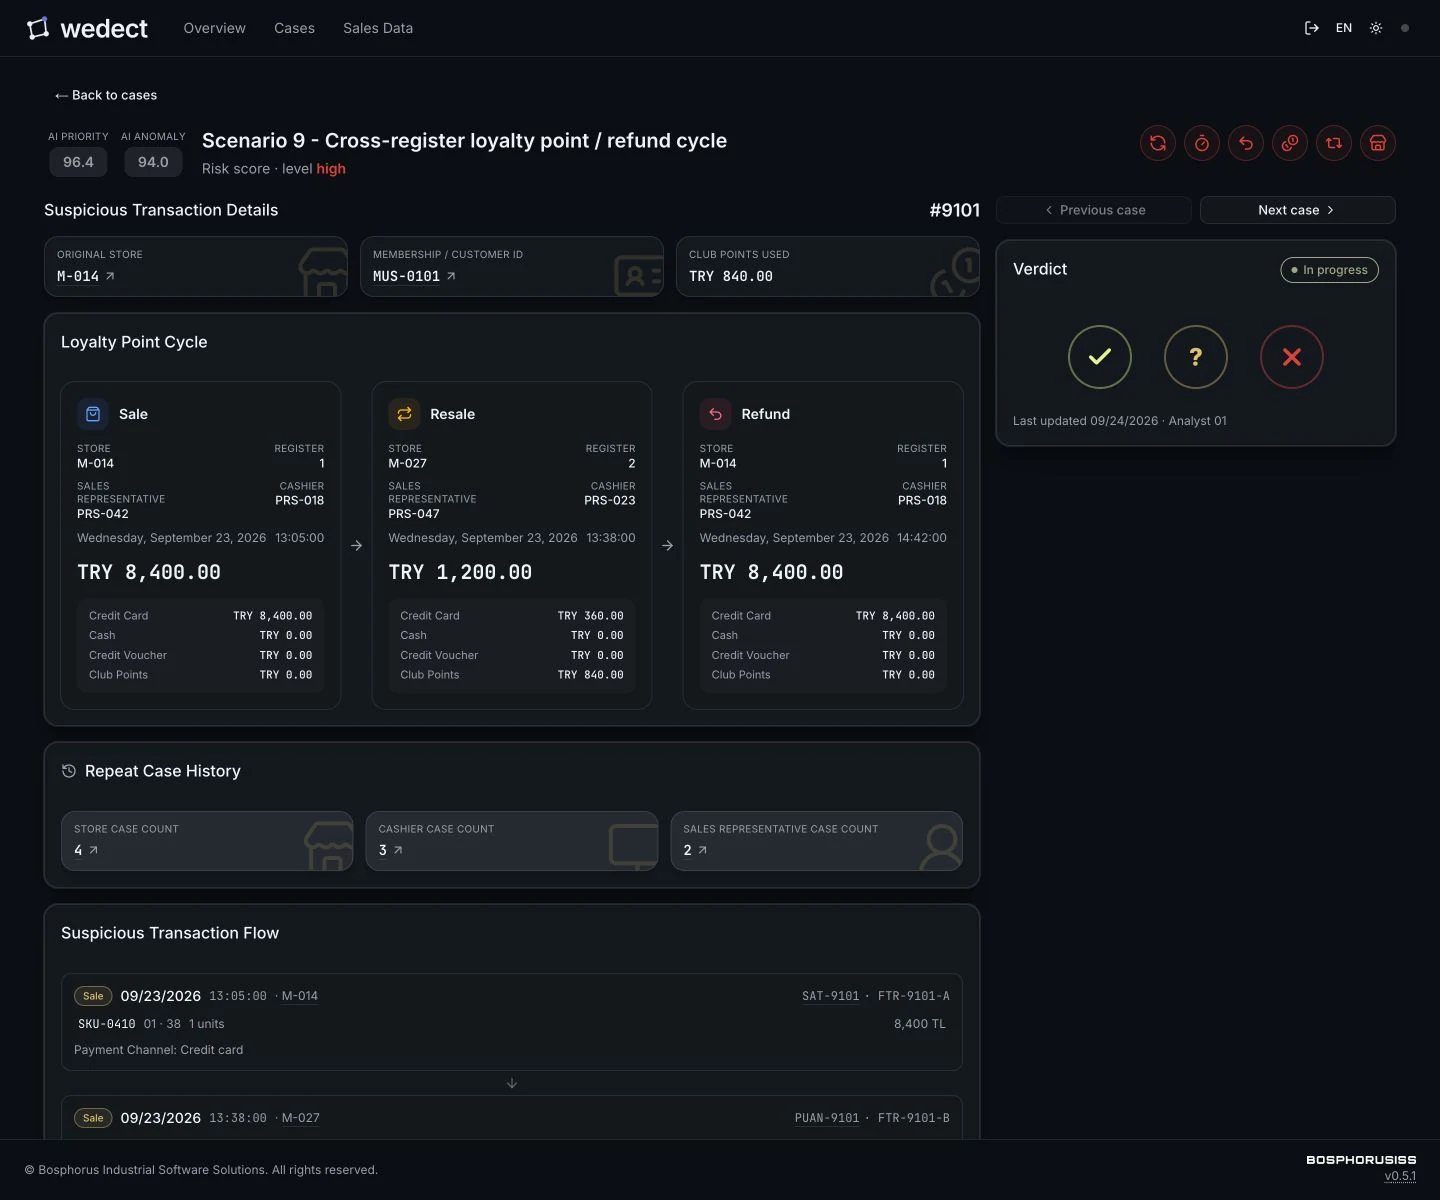
Every case arrives like this. Figures are cases recommended for review and the transaction value they touch — not confirmed loss.
Deployment
No data leaves, no new vendor holds your transactions, and the paperwork your legal team will ask for is already in the box.
REST · Database · Kafka · Batch · Data warehouse
On-premise or private cloud. Transaction and customer data never leaves your infrastructure.
Only the audit team sees risk scores. Identities stay masked until a case is opened. Retention periods are defined and enforced.
Impact assessment template, data processing inventory, staff notice, and deletion policy — shipped with the deployment, for GDPR and KVKK.
In production
Where the same patterns run
If your chain runs returns, discounts or a loyalty program across more than a handful of locations, the same chains show up.
We take six months of transaction data from one store group, run it, and go through the cases with your audit team. You judge the results, not us. No change to your POS or ERP.